Corrected Anion Gap Calculator
Adjust the observed anion gap for serum albumin using the Figge equation AG + 2.5 × (4.0 − albumin). In hypoalbuminemia the raw gap under-reports unmeasured anions — this calculator reveals the true value.
What is an albumin-corrected anion gap?
The albumin-corrected anion gap adjusts the conventional anion gap for the patient's serum albumin concentration. It is the right tool whenever a critically ill or hypoalbuminemic patient has a "normal-looking" gap, because albumin is the dominant unmeasured anion in plasma — and as it falls, the entire gap falls with it. A raw value that looks reassuring in a patient with albumin of 2.0 g/dL can hide a genuine high-anion-gap metabolic acidosis (HAGMA).
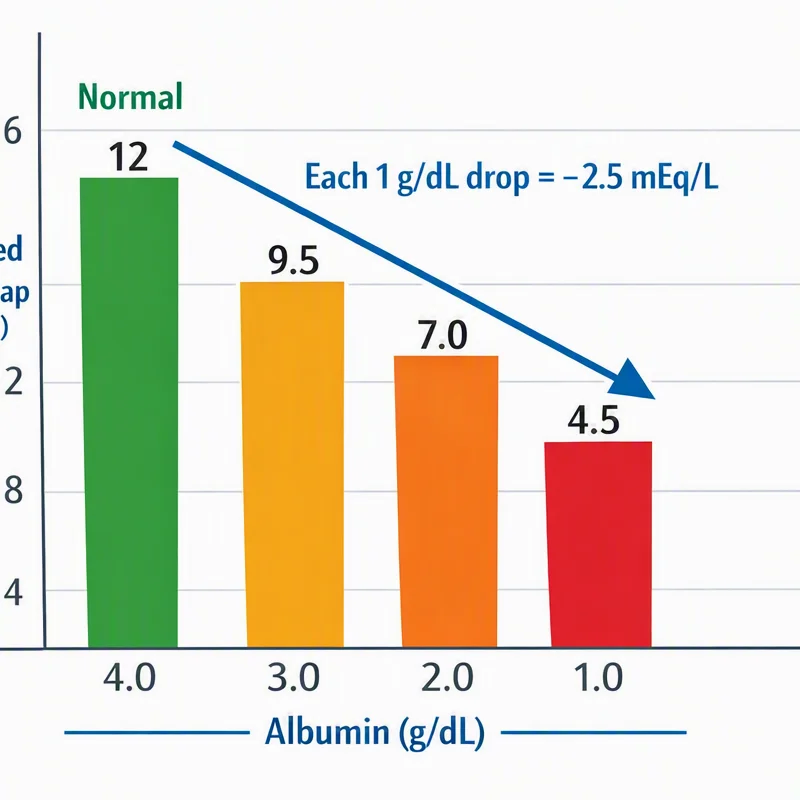
The correction, known as the corrected anion gap formula (the Figge equation), restores the gap to what it would be if albumin were normal at 4.0 g/dL: corrected AG = observed AG + 2.5 × (4.0 − albumin g/dL). Because every 1 g/dL drop in albumin lowers the expected "normal" gap by roughly 2.5 mEq/L, the correction adds back that hidden 2.5 mEq/L per gram of deficit — which is exactly why albumin matters when you read an anion gap result.
Worked example
Take an ICU patient with sodium 138, chloride 104, bicarbonate 22, and albumin 2.0 g/dL. The raw gap is 138 − (104 + 22) = 12 mEq/L — sitting at the top of the conventional 8–12 range, so it reads as normal. But apply the Figge equation: 12 + 2.5 × (4.0 − 2.0) = 12 + 5.0 = 17 mEq/L. The corrected gap is clearly elevated, unmasking a HAGMA that the raw number alone understated by 5 mEq/L. This is the precise scenario where the correction changes clinical decision-making — it triggers a search for lactate, ketones, toxins, or uremia that a false-normal raw gap would have delayed.
Interpreting the corrected value
After correction, the same reference logic applies: a corrected anion gap above 12 mEq/L is elevated and points to a high-anion-gap metabolic acidosis. A corrected value that remains within 8–12 mEq/L means the gap is genuinely normal even after accounting for albumin. For completeness, the calculator displays both the observed (raw) and corrected gaps side by side, so you can see exactly how much of the gap was being hidden by the albumin level.
The Figge equation is symmetric. If albumin is high (say 5.0 g/dL in dehydration), the correction subtracts from the observed gap: 2.5 × (4.0 − 5.0) = −2.5 mEq/L. This matters because a mildly elevated raw gap at a high albumin can normalize after correction — the reverse of the hypoalbuminemia problem.
This calculator runs entirely in your browser — no values are transmitted or stored. The Figge equation and interpretation logic are reviewed against StatPearls and LITFL acid–base references. Results are informational only and should always be interpreted in full clinical context by a qualified clinician, alongside the reference range supplied by the testing laboratory.