DKA with a High Anion Gap — Worked Example
A 23-year-old with type 1 diabetes presents in diabetic ketoacidosis. This case walks through the anion gap calculation, the delta ratio, fluid and insulin therapy, and the anion gap closure that signals biochemical resolution.
Presentation
A 23-year-old man with a five-year history of type 1 diabetes is brought to the emergency department with two days of nausea, vomiting, and abdominal pain. He ran out of insulin one week ago. On examination he is tachypneic (respiratory rate 32) with deep sighing (Kussmaul) respirations, dry mucous membranes, and a fruity odor to his breath. He is drowsy but arousable. Point-of-care glucose is "high." A venous blood gas and basic metabolic panel are sent immediately.
Initial laboratory values
The hyponatremia is partly dilutional — hyperglycemia draws water into the extracellular space and lowers measured sodium. The corrected sodium (using the standard +1.6 mEq/L per 100 mg/dL glucose above 100) is approximately 128 + 1.6 × ((612 − 100)/100) ≈ 136 mEq/L, close to normal. The potassium is elevated on a total-body-deficient basis (intracellular potassium shifts out with acidosis and insulin deficiency) — repletion, not restriction, will be needed once insulin therapy begins.
Anion gap calculation
Applying the formula AG = Na⁺ − (Cl⁻ + HCO₃⁻): 128 − (96 + 8) = 128 − 104 = 24 mEq/L. Against the conventional reference interval of 8–12 mEq/L, this is a markedly elevated gap. You can confirm the arithmetic in the anion gap calculator, which also flags the result and applies the albumin correction when albumin is available. The combination of a high anion gap, low bicarbonate, acidemic pH, ketonemia, and hyperglycemia is diagnostic of diabetic ketoacidosis — a classic high-anion-gap metabolic acidosis driven by β-hydroxybutyrate and acetoacetate accumulation.
Delta ratio — is the disorder purely HAGMA?
To check for a second, concurrent metabolic disturbance, calculate the delta ratio:
- ΔAG = observed AG − normal AG = 24 − 12 = 12
- ΔHCO₃⁻ = normal HCO₃⁻ − observed HCO₃⁻ = 24 − 8 = 16
- Delta ratio = ΔAG / ΔHCO₃⁻ = 12 / 16 = 0.75
A ratio in the 1–2 band indicates a pure HAGMA. A ratio below 0.8 suggests a concurrent normal-anion-gap (hyperchloremic) metabolic acidosis. This patient's ratio of 0.75 sits at that threshold, reflecting a small additional hyperchloremic component — clinically plausible given his vomiting-related volume contraction and the anticipated saline resuscitation. The dominant process remains ketoacidosis. The full clinical picture is covered in the DKA and the anion gap disorder guide.
Treatment course and anion gap closure
Management follows standard DKA protocols: aggressive isotonic saline and potassium repletion, a weight-based intravenous insulin infusion to suppress ketogenesis, and frequent monitoring of glucose, electrolytes, and the anion gap (Kitabchi et al., ADA Consensus; JBDS-IP guidelines). Bicarbonate is not routinely administered in DKA with pH > 6.9 — the bicarbonate deficit calculator documents the magnitude of the deficit for reference, but the ketoacids are metabolized once insulin restores normal carbohydrate utilization, regenerating bicarbonate endogenously.
Over the first 12 hours the anion gap is the single most useful tracking variable. Serial measurements:
| Time | Na⁺ | Cl⁻ | HCO₃⁻ | AG | Glucose |
|---|---|---|---|---|---|
| 0 h (presentation) | 128 | 96 | 8 | 24 | 612 |
| 4 h | 132 | 102 | 11 | 19 | 340 |
| 8 h | 136 | 106 | 15 | 15 | 185 |
| 12 h | 138 | 107 | 19 | 12 | 142 |
| 24 h (resolution) | 139 | 105 | 23 | 11 | 118 |
The anion gap closes in lock-step with the falling glucose and ketone concentration. By 12 hours the gap has normalized (12 mEq/L), and by 24 hours it sits at 11 with a recovered bicarbonate of 23. Note that the chloride transiently rises as bicarbonate is regenerated — a normal physiologic pattern. The transition from IV insulin to subcutaneous basal-bolus regimens is safe once the anion gap has closed, the patient is eating, and a subcutaneous dose has been onboarded. The broader principles of using the gap to time insulin transitions are covered on the DKA management page.
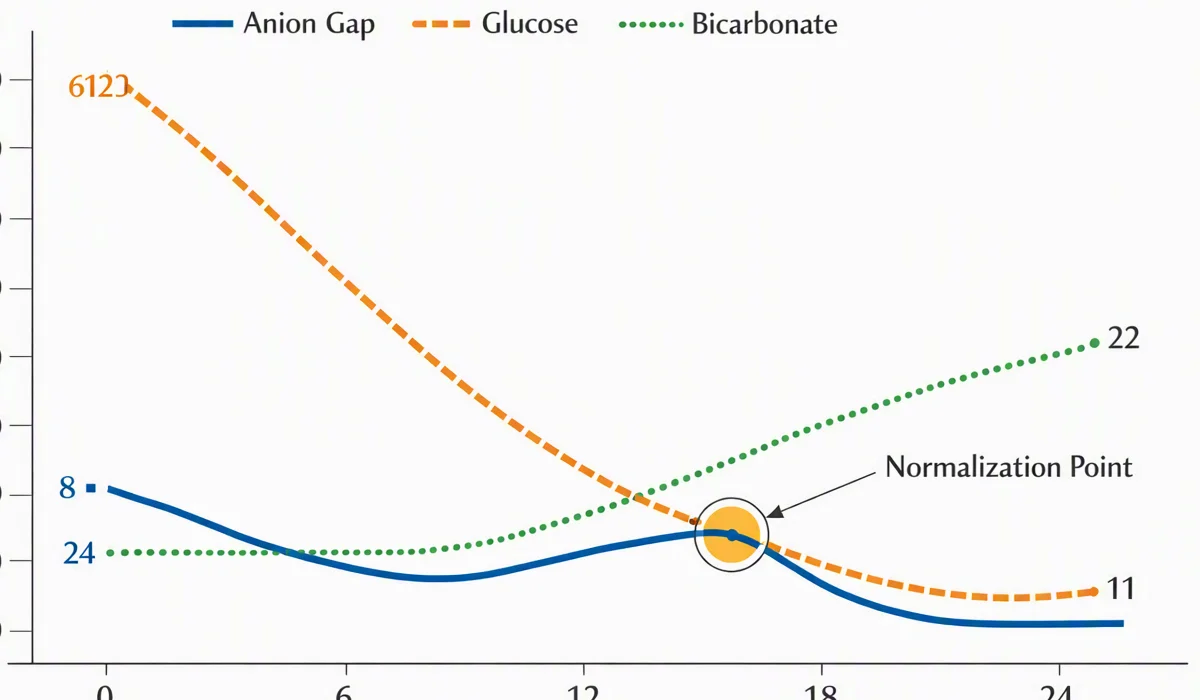
Glucose falls faster than ketones clear, so glucose alone is a poor marker of DKA resolution. Track the anion gap (or beta-hydroxybutyrate) until it normalizes before declaring DKA resolved — a normal glucose with a persistently elevated gap signals ongoing ketogenesis requiring continued insulin infusion.
Key lessons from this case
- Calculate the anion gap first — it converts a non-specific "metabolic acidosis" into the HAGMA differential and immediately triggers the DKA workup alongside lactate, toxic alcohol, and renal causes.
- Correct the sodium for hyperglycemia before judging the anion gap; dilutional hyponatremia narrows the calculated gap and can mask a truly higher value.
- Use the delta ratio to detect mixed disorders; here, the borderline-low ratio hinted at a small concurrent hyperchloremic component that becomes more pronounced during saline resuscitation.
- Track the anion gap serially — closure of the gap, not normalization of glucose, defines DKA resolution.